

Click to view a larger image
This Scottish scientist produced a spreadsheet model of an electricity generating system composed primarily of wind turbines backed up with pumped-storage hydro-electricity schemes. Such modelling can predict how much wind power and pumped-storage energy capacity should be installed for satisfactory renewables-only generation.
The spreadsheet line graph above plots power & energy variables for the time-line modelled –
- curves for power exported, demanded, from wind, for pumping, from the hydro-turbine &
- a curve for the energy stored by water pumped into the upper reservoir.
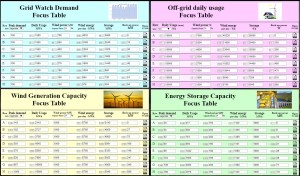
The time-line graphs data for the grid in Scotland, normalised in proportion to wind power and demand data for June 2014, as downloaded from the Gridwatch Database of the U.K. National Grid Status Website.
Modelling assumptions for this graph –
- an installed maximum wind turbine power in Scotland of 33GW
- an installed pumped-storage hydro energy capacity in Scotland of 160GWh
- the pumps have a maximum power consumption of 6GW
- the hydro-turbines have a maximum power output of 6GW
- the pumps and the hydro-turbines both have an efficiency of 88%
- the peak demand in Scotland in 2014 was 6GW
- no other power stations are generating power
I used estimated relative costs of wind turbines versus pumped-storage hydro to arrive at a optimal minimum cost balance –
- store energy capacity = 1.5 days x peak demand power
- annual maximum wind power = 7 x peak demand power
I conclude that such models will help to take the guesswork and uncertainty out of renewable-energy electricity system design!


The next power grid and energy storage timelines illustrate that when the system is under-powered, for the very low wind conditions over Britain in the period September 2014, with an annual maximum wind power of only 5.5 x peak demand power and storage energy of only 1.11 days x peak demand, the energy store runs out, the reservoir(s) drain dry and the system requires to import energy to meet demand.

With the recommended
- store energy capacity = 1.5 days x peak demand power
- annual maximum wind power = 7 x peak demand power
the system has enough wind power and energy storage to cope with the very low wind conditions of September 2014.

Note that in Graph 5, the maximum pump power is equal to peak demand and therefore cannot exploit all of the available wind power on Sep/7 18: to 23: hours and similarly on Sep/14, forcing the system to export precious power in a week when wind power was in short supply.
This suggests that increasing the installed maximum pump power from a nominal 100% up to at least 115% and perhaps as much as 145% of peak demand power could somewhat more efficiently take advantage of a few gusty hours on low wind days assuming that the power line transmission capacity between the wind generators and the pumps exceeds peak demand and that the water flow rates could increase by the appropriate percentage too.
Back-up Generators
A similar system but including back-up generators (such as biomass power stations) was modelled.

The system modelled in graph 6 differs from that in graph 4 with the addition of back-up generators with a power capacity of 15% of peak demand which power up when the energy store drops to 75% of maximum capacity, thereby successfully avoiding the need for imports even during the extreme low wind weather event of September 2014.
Graphs 7 to 12 give further examples of many possible system configurations.


Wind 3.3 x peak demand (173,200 MW), Back-up 0.35 x peak demand ( 18,400 MW)


Table of wind, pumped-storage & back-up factors
The factors in the table are peak demand power multipliers. Each row triplet describes a possible system configuration for 24/7/52 reliable 100% renewable energy generation.
| Row | Wind power | Storage days | Back-up |
|---|---|---|---|
| A | 7 | 1.5 | 0 |
| B | 5.5 | 1.1 | 0.15 |
| C | 4 | 0.8 | 0.3 |
| D | 3.3 | 0.7 | 0.35 |
| E | 2.7 | 0.6 | 0.4 |
| F | 1.9 | 0.4 | 0.47 |
| G | 1.5 | 0.3 | 0.51 |
| H | 1 | 0.21 | 0.56 |
Wind, storage and back-up system designer
Wind farm on-site energy storage
This simple modelling glosses over how wind power surpluses can be “exported” or from where power deficiencies can be “imported” to meet demand?
Wind farms could “export” their power generation surpluses no further than to on-site energy storage facilities and “import” power from those stores to meet demand at times of low wind.
A more complex computer model which includes on-site energy stores would be useful to research in future work.
A footnote on the limitations of spreadsheets with large data-sets.
The Gridwatch data consists of 1 row of data every 5 minutes of time recording, 12 data rows an hour, 288 a day, 2016 a week, 26208 a quarter and 104832 for a full year. The data as downloaded also comes with a number of erroneous data values that must be painstakingly weeded out.
Microsoft Works Spreadsheet cannot read in a quarter of a year of data because it does not allow more than 16,384 rows. Excel on a PC may do but since I don’t buy Excel and the free online version doesn’t seem to read .csv files, I gave up with Excel.
Google Sheets free online I managed to use to read up to 3 months of data though I found it became sluggish and buggy with 25,000 rows in a sheet with multiple columns with complex formulas but I got the results I wanted with perseverance. Google Sheets could not handle a year of data rows though.
Example Spreadsheet Model produced using Google Sheets
Download Spreadsheet model .xlsx file
Download the spreadsheet model file from the above link.

Libreoffice spreadsheet can read over 1 million rows (after version 3.3.3), so tha tshould keep you going for a while. It’s free sofware and runs locally, not over your browser like google docs.
But spreadsheets are not ideal for large-data modelling. You’d find something like R a lot more powerful and convenient in the long term.
Interesting work though, thanks for posting it. If you posted your sheet (or a small sample showing your modelling sums) I might try doing it in R as a learning excercise. (I realise the modelling is pretty simple in this case but it’d be good to check we were doing the same ting rather than me making it up from scratch).
LikeLike
Thanks for your suggestions Wookey.
Check the end of post for an edit where I have added a link to download a .xlsx file of the spreadsheet model. I’ll email you it as well so that you can email me back if you want to send me attached files.
LikeLike
Nice work. I did something very similar and ran into the same issues. How did you generate these visually attractive graphics?
LikeLike
Thanks Heiko and welcome to my Scottish Scientist blog.
I generated the graphics using Google Sheets – “Charts”.
My “Example Spreadsheet Model .xlsx” file (download from the link at the end of my post) contains the chart for my “Line graph of power grid and energy store timeline – January, Scotland” image.
To view the chart and experiment with it, upload the .xlsx file to Google Sheets and click the “January Chart” tab.
LikeLike
Hi, nice work. Are you still working on this modelling? I’d be happy to code it in R, as suggested by Wookey
LikeLike
Hi Aiora and welcome to my Scottish Scientist blog!
I’ve not taken this modelling any further and neither have I heard back from Wookey since.
So, of course, code it in R as you please. I’ll email you with Wookey’s email address so that you two can collaborate if you wish, safe in the knowledge that you are not duplicating my non-existing R code!
If you or anyone does build on this work I would welcome you commenting here in future, to report progress, perhaps post a link to anything you wish to publish.
LikeLike
Hi there,
I don’t know if you are already familiar with it but you should have a look at work that has been done by the Energy Systems Research Unit (ESRU) at the University of Strathclyde, in particular a program called MERIT which can be used for demand matching with renewables (you may need Linux to run the software as the windows version wasn’t particularly stable when I last used it). http://www.esru.strath.ac.uk/Programs/Merit.htm
LikeLike
Aiora already has my address. I put her on to this task as she is an R expert and I am not, and I realised that it was likely to be years before I got round to doing anything 🙂
LikeLiked by 1 person
Hey, please see a work-in-progress to reproduce the analysis & plots in R:
http://people.ds.cam.ac.uk/az296/docs/Rscripts/
Would be good to have a chat to see how to complete the script and make it usable to process the full datasets.
LikeLiked by 1 person
A collaborator, and I (UK) modelled Texas using 3 years of hourly data on load, solar, wind and solar in various locations, with 26,000 odd rows. Excel from Office 2010 works fine with this. Free Apache Open Office has difficulty opening the .xlsx file (15.2MB), but if saved in .ods form (16.7MB), then Open Office can read it without struggling. It also recalculates fine. FORTRAN also works fine with the data of course. Haven’t tried Libre Office.
Your resolution of 3 minutes is unnecessarily short. Not only will there be statistical smoothing of local wind farm peaks and troughs due to the spatial dispersion over Uk or even Scotland, but also pumped storage can respond to a drop in the wind in much less than 3 minutes. As long as you meet demand, it doesn’t matter much if you curtail a small fraction of wind if you can’t respond fast (reverse generators to become pumps) enough to store it. You spend very little of the time around zero pumped storage charge state – mostly you are either in store, generate, or full state.
Hence it makes more sense to use hourly resolution and a longer period, as one very important output is the gaps which wind + pumped hydro cannot satisfy. A month of data is not really enough. You need one or preferably more years.
Also, assuming zero carbon generation, if you are not costing in the tier 2 backup (for multiple still days), then you do not know what the optimum cost solution is.
Specifically you are generating 3.7 times as much wind power as the average load so your wind power costs may be excessive – you are throwing away a lot of wind power, maybe unnecessarily. You probably have to install tier 2 (my definition) backup generation (fuel cell or gas turbine if using renewable gas storage) approaching the average load of 4GW anyway, so the question is how much you have to use it and therefore what the costs of manufacturing renewable gas are.. Even allowing for the round trip hydro pump/generator losses it looks like you have too much wind. You may also have too much pumped hydro storage capacity, but that depends on the relative cost for pumped hydro versus, say renewable gas storage for the longer-term storage.
My guess is that the costs will be optimised if the gaps in wind + pumped storage remain in single digits and that you can hit that with much less wind generation.
In other words, you need a cost model, based on future prices, alongside the grid model to optimise the costs, to compare them with an all-nuclear solution.
LikeLike
Hi Peter and welcome to my Scottish Scientist blog after our comments on The Economist, Nuclear Power story – “When the facts change… Hinkley Point would tie Britain into an energy system that is already out of date”.
5 minutes, not “3 minutes”, Peter, which is too high a data resolution, producing too many rows in a spreadsheet, so to reduce the data resolution for modelling, I added a “Merge Rows” menu function to Google Sheets, which I used in the example spreadsheet .xlsx file, to average 12 x “5 minute” rows into 1 row every hour.
I modelled hourly data rows in April 2015, for practical modelling purposes, unrelated to your irrelevant, confabulated explanation, the besides-the-point verbiage, you have commented in August 2016. I am not interested in why, in your mind, what I did more than a year ago “makes more sense”.
Don’t tell your grandmother how to suck eggs and why doing so makes more sense because you will get a flea in your ear.
It is possible with my method and the spreadsheet tools I have used to model one or more years by modelling 3 months at a time.
The simple wind and pumped-storage power system I have modelled does not include a second tier of energy storage, such as using some or all of the surplus power (which I have labelled “export” and coloured turquoise in the charts) for power-to-gas.
A more complex system, employing a 2-tier energy store,
is of great interest and naturally, modelling such a 2-tier energy store system is very helpful and so I’m encouraged by all such efforts undertaken by others and I am sad that I have not found the time to do it myself.
I am somewhat mystified how it can be that you seem to have stumbled from the basis of my modelling examples
annual maximum wind power = 5.5 x peak demand power
which means that if
peak demand power = 1.6 x average demand power
then
annual maximum wind power = 8.8 x average demand power
to your claim “Specifically you are generating 3.7 times as much wind power as the average load”. Have you divided instead of multiplying or what?
Yes the simple system I have modelled does “throw away” (in other words, have available for export or power-to-gas) lots of wind power.
Yes with a 2-tier energy store one might well need to use less wind power and / or less pumped-storage hydro. We think alike on this Peter.
I can read that you are writing about all the relevant issues that only modelling a more complex system with a 2-tier energy store will answer satisfactorily.
In an ideal world I would have the time to apply myself to such an interesting and useful modelling task but sadly, I have had to be otherwise occupied and distracted with other unwelcome, pressing and forceful distractions and obstructions to my duties as a scientist. Perhaps if was to get nominated for the Sakharov Prize they will leave me in peace to do my science?
No amount of you or other colleagues telling me what I need to do is going to allow me the time to do it. If only things were that easy Peter. Thanks again for your interest.
LikeLike
** words surrounded by **…** are my definitions.
Scottish Scientist, Adding a few simple additional formulae to your spreadsheet showed that average wind power **GENERATION** (= GW wind capacity x wind capacity factor) is 3.7 times average load. Your statement is that you need a wind **CAPACITY** (in peak GW) which is 5.5 times the peak load capacity. The two statements are not incompatible. While I would be the last person to claim I never make mistakes, given your figure for wind capacity (GW) of 5.5 times average load, 3.7 times for generation (GWh) seems very plausible.
Your charts are excellent, but having gone to the trouble of doing a proper model surely you would also be interested in the fraction of wind **GENERATION** that a) satisfies demand directly b) satisfies demand after going through the pumped hydro storage c) is lost in the inefficiencies of pumped hydro cycling and d) gets exported. It doesn’t take long to add the relevant formulae.
It seems that well over twice as much wind power gets exported (or is unused) as is used to satisfy local demand. If exported then the system you are analysing is thus far from being a self contained system. To get to a local 100% renewable solution you are either happy to incur big costs in throwing away most generation or expecting someone else to provide the storage for the electricity exported – your storage system only covers storage for electricity used locally, not for all electricity generated locally. To smooth all generation to match load profiles you would need pro rata something like another 400 GWh of storage, or most likely more as the exported power will be too small at those times when local needs are only just being met by wind.
Remember that it was you who questioned my comment on the Economist site that 1,200 GWh (for a larger system) was insufficient, pointing to your write up on this site as justification. However, the large fraction of generated wind power which is not used (or is exported) in your system appears to confirm my original statement.
I sympathise with the inability to spend as much time on this stuff as you would like as I have had exactly the same problem. But please keep up the good work anyway.
LikeLike
Ah. For the (windy) “January” data I made available for download in the example spreadsheet, the average wind power is “3.7 times” the average demand. OK.
You threw me off your meaning by writing about the modelling you claim to have done and by failing to acknowledge I had modelled hourly rows in my example spreadsheet, so I really missed the fact that you were referring to my spreadsheet example which I have made available for download. So did you use Google Sheets on my file or if not, what spreadsheet program did you use it with and did it work fine?
You made another mistake “5.5 times
averageload” in that very sentence when you would be the last person to claim never to make mistakes. Your previous sentence was better – “5.5 times the peak load capacity”.To repeat, the basis of my modelling examples, in terms of peak or average (terms which you seem to have confused) demand power is –
annual maximum wind power = 5.5 x peak demand power = 8.8 x average demand power
If you have additions to my spreadsheet example which you have made which you are sure that I or some other reader here should be interested in, you are welcome to go the trouble of showing us what you have done, by posting links here in comments to your own spreadsheet example file if you can get it hosted for download somewhere, which might be your own modifications of my spreadsheet example file, or all your own work, as you please.
Yes, for that particular windy January, “well over twice as much wind power gets exported (or is unused) as is used to satisfy local demand”. Other less windy months – such as charts above for “Scotland – June” or “the UK – April”, there is not the same “3.7 times” ratio of wind power to demand and so proportionately less power is available for export.
The amount of power which is available for export, power-to-gas etc. is not really a big problem. It’s a bonus, a happy by-product of installing enough wind power to meet demand when the wind is becalmed. This bonus can be taken advantage of, if that is profitable for all concerned, but its availability isn’t a burden per se. If any of the export power is not wanted it is easy enough to curtail the wind turbines power output. Instead of paying wind turbine operators to curtail, the National Grid could fine them for failing to curtail when required to do so.
I won’t bandy words with you regarding your unwelcome empty suggestions, insinuations and hot air because I really don’t have the time, sorry.
When you have some “excellent charts” of your own to post that prove your points, maybe then we can discuss this further?
LikeLike
[Entered again as it doesn’t seem to have been accepted the first time. Please delete if a repetition.]
Scottish Scientist, don’t confuse typos with lack of understanding.
By 2050 UK needs most primary energy to be provided by renewables and most building and water heating ought to be provided by electric heat pumps. While January wind power may indeed be much higher than in summer, so will the demand. This is the reverse of Texas where the peak loads are caused by peak summer air conditioning demands.
If 2030 Scottish wind power costs were as little as 3p / kWh generated, overconfiguration of generation by a factor of x 3.7 would make the wholesale cost of wind power 11.1p / kWh supplied before adding pumped hydro storage costs. Future electricity would be considerably more expensive than at present, and more expensive than baseload Hinkley Point C nuclear at 9.2p or 8.9p / kWh which everyone rightly considers to be expensive compared to what could be achieved with wind. When you have time, the addition of renewable gas storage would surely bring your implied wholesale costs down.
Send an email to gmail user peter090654 and I’ll send you back a slightly amended version of your spreadsheet. I used Excel from Office 2010, though Open Office also seems to work. If you are serious about this stuff and not philosophically averse to using Microsoft products then it might be worth buying Excel because it does seem quicker than Open Office. R code is an alternative way to go, and would at least provide a check on correctness, but speaking as someone who writes plenty of Java code, the spreadsheet approach is much quicker than coding if you are skilled in both.
The Texas grid model data needs to be checked to confirm the data is all from public sources and nothing is confidential. It also needs changes to explicitly add tier 2 storage to avoid misunderstandings. It may take a few weeks to publish it, but that is the intent.
Regards,
Peter
LikeLike
Peter, all comments on this blog are held for approval by me before appearing. I approved your second attempt in preference to your first because you managed correctly at the 2nd attempt to use the [REPLY] button under a comment you were replying to which files comments in the conversation in the one comment-thread (whereas your 1st attempt you must have incorrectly used the “Leave a Reply. Enter your comment here…” box at the foot of the page which starts a new comment thread, possibly on a new page of comments).
Oh, would you like me to correct your typos – replacing with “peak” where you typo-ed “average”?
The cost to generate wind power is not proportional to the wind power that day, or that month but is more related to the cost of the wind turbines which have been installed and their maintenance.
The configuration modelled was that of
“annual maximum wind power = 5.5 x peak demand power”.
Peak demand in the spreadsheet example modelled is 6GW. Therefore wind data was normalised to have a yearly maximum wind power “Installed Wind” of 5.5 x 6GW = 33GW.
In my Scotland Electricity Generation – my plan for 2020 I estimated that about 10 times more would be needed to be spent on wind turbines as on the pumped-storage. As you suggest, a 2nd tier of inexpensive but inefficient storage may reduce overall system costs, but that requires to be modelled by someone with the time to do so.
I’m not interested in your “slightly amended version of” my spreadsheet because the trivial change to calculate data averages is something I already did [download link] to figure out where on Earth you were getting your irrelevant “3.7” figure from which you continue to obsess about and irritate me with.
I have no need to receive email from, or send email to, anyone who insists on flouting their own personal obsession about average wind power from one month’s data.
If, however unlikely it seems today, I ever wanted to email you, neither do you need to post your email address in comments because the email addresses of comment authors seems to be included automatically by the WordPress blog software in the moderation screen information alongside the comments.
So I had your email already but I haven’t written to you because I have no need to.
Another colleague reported that Excel had problems with my spreadsheet data file because of an erroneous detection of a spurious ‘circularity’ in the spreadsheet cell formulae but if you say Excel manages with my spreadsheet example file OK then it must be something else the other colleague did to provoke the circularity problem.
When you have something to publish here please get it hosted yourself somewhere and post a link to your file in comments. Don’t send files to me by email because I don’t want to have to host it in my wordpress account just so that other people can see what you have done.
Don’t waste your time doing anything for my eyes only because I may not be available in future. The best you can expect is that I am available to approve comments on this blog but I cannot even guarantee that, no more than Andrei Sakharov could guarantee the Soviet authorities would leave him in peace to do his duties for science.
LikeLike
The Wind-Hydro-Pumped Station of El Hierro
To quote
But the system developed by Gorona del Viento is not meeting its aims. I’ll explain why and what changes are required to the system to get it to work as intended.
Assuming El Hierro peak demand is 7.6MW
Put the 7.6MW peak demand into my recommendation equations
(Edit – 30/03/17. Following my change in recommendation,
store energy capacity = 1.5 (up from 1.11) days of peak demand power,
annual maximum wind power = 7 (up from 5.5) x peak demand power
I’ve recalculated for the new higher figures)
store energy = 1.11 days x 7.6MW = 8.436 MW-days = 202.5 MWh = 729 gigajoulesstore energy = 1.5 days x 7.6MW = 11.4 MW-days = 273.6 MWh = 985 gigajoules
Assuming the head between the 2 reservoirs to be 655 metres, the volume of reservoir required is
volume = mass / density
volume = energy / (g x head x density)
volume = 729,000,000,000 / (9.81 x 655 x 1000)volume = 985,000,000,000 / (9.81 x 655 x 1000)
volume = 113,500 m3volume = 153,300 m3
So the GdV reservoirs seem to be big enough and no change to the reservoirs is required.So the lower GdV reservoir with a nominal volume of 150,000 m3 is within a few percent of the recommended minimum of 153,300 m3.
Now let’s find the recommended annual maximum wind power.
annual maximum wind power = 5.5 x 7.6MW = 41.8MWannual maximum wind power = 7 x 7.6MW = 53.2MW
Whereas only 11.5 MW of wind turbine nameplate capacity is installed.
I’m not sure what the annual peak wind power is now (8MW is the maximum MW plotted in figure 4 here) so let’s assume that 8MW is the annual peak wind power now.
Now – needed — factor increase compared to existing
8MW – 41.8MW – 41.8/8 = 5.2 times more wind power needs to be installed, to a total nameplate capacity of 5.2 x 11.5 = 59.8MW8MW – 53.2MW – 53.2/8 = 6.65 times more wind power needs to be installed, to a total nameplate capacity of 6.65 x 11.5 = 76.5MW
Executive conclusion.
The El Hierro GdV wind turbines are under-powered by a factor of 7 compared to what will be needed for a successful system design to achieve 24/7/52 100% renewable on demand power.
The recommendation is that additional wind turbines be installed to a total capacity of 80MW.
Acknowledgement – Thanks to the Energy Matters blog for bringing this to my attention.
LikeLike
I’d post this over on Euan’s blog where you originally left this comment, but I get a chronic “Invalid security token” error when I try to reply there.
I’m not sure that works. Wind turbines have non-zero “hotelling” power requirements even when becalmed, and the bigger the fleet the larger those demands are. It appears that once your all-RE system “falls down”, it probably can’t get back up.
Electricity is the ultimate perishable good, isn’t it? There might be ways to deal with this using the right systems approach, but so far nobody’s gotten there. For instance, if you used a molten silicon heat battery feeding an 8 MW gas turbine you could power El Hierro with a round-trip efficiency of perhaps 38% and at least a day of storage. But what you really need is storable energy.
There was a chance discovery a few years ago: Penn State researchers found that archaea can turn CO2 and electrons directly to methane at 80% efficiency. I’m sure you see the possibilities in that, especially if thermophilic archaea are capable of this trick (you wouldn’t have to force-cool bugs that like living in boiling water). You convert excess electricity plus CO2 into methane and liquefy the methane. If you run out of excess wind power you also run out of cooling energy, but you needed to burn methane for electricity anyway so you just put the boil-off through your old diesel-converted-to-spark-ignition generators.
LikeLike
Hi, Great work and a very interesting read on a future electricity scenario.
I too am trying to model a 100% renewable electricity scenario in Scotland where the supply meets the demand(41TWh/year) at all times and an assumption that there is no import/export with UK and Ireland.
For this the total renewable installed capacity is 16GW, of which the wind installation accounts for 11.52GW hydro is 3.52GW, 840MW biomass plant serving as baseload(on all the time) and the remaining 0.12GW from wave and tidal.
I am using the distribution curves over the year 2015 obtained from grid watch(used hourly values) to get the energy output in GWh and am able to calculate the total energy output from the installed renewable capacities.
However i am getting stuck at calculating the required storage capacity for a pumped hydro system to store the excess of the intermittent renewable energies so that it can be supplied in the low renewable generation months i.e in October-November. I am getting a storage capacity of around 3600GWh and pump/turbine installed capacity of 8500MW.
Please can you help me out. How to calculate the required storage capacity for the system?
Thanks in advance.
LikeLike
Hi Janeet and welcome to my blog.
For the design of simple wind turbine / pumped-storage systems I recommend a formula pair –
store energy capacity = 1.5 days x peak demand power
annual maximum wind power = 7 x peak demand power
So for “Scotland” assuming a peak demand of 6GW, my formula pair recommends
store energy capacity = 1.5 days x 6 GW = 9 GW-days = 216 GWh
annual maximum wind power = 7 x 6 GW = 42 GW
I note that your values are quite different, much higher energy storage capacity (3600GWh) and much lower annual maximum wind power – (11.52 GW installed, maximum wind power something less presumably).
I am unable to advise as to how it is you have calculated / miscalculated such a high figure for energy storage capacity – “3600GWh” – which is an order of magnitude higher than my recommendation – surprisingly high for a complex system with the advantages of conventional hydro and biomass generation for baseload which really ought to substantially reduce the required energy storage capacity.
I’m sorry to learn that you are temporarily stuck but I do not now have the time to examine your modelling and calculations but no doubt you can un-stick yourself with sufficient dedication or perhaps someone else will offer to help you? Please do feel free to post again to let us know if you make any progress.
My recommended formulae come as a pair because if the designer reduces the annual maximum wind power (down from 7 to something lower – 6, 5, 4, 3, 2 etc) then for the system still to supply power to meet demand without power imports then the energy storage capacity must simultaneously be raised (up from 1.5 to something higher 2, 3, 4, 5, 6 etc).
Only modelling can tell which pair of formula would work without needing power imports. There is an infinite number of formula pairs that will work and the reason for selecting the pair I did was to minimise costs assuming a certain ratio for the relative costs of wind turbines and pumped-storage.
With different cost assumptions, a different lowest-cost formula pair will emerge. For example, if upgrading existing hydro reservoirs to pumped-storage operation the relative cost of pumped-storage will be lower than the relative cost I assumed which was deduced from cost estimates of a planned new-build pumped-storage scheme (Coire Glas).
My example spreadsheet model .xlsx file (which can be downloaded from the link I included in my post) demonstrates how to calculate the changes to the energy of water stored in the reservoir(s).
In the version of the spreadsheet I am looking at, the input parameter cells are coloured lilac –
G3 – peak demand power in megawatts
H11 – annual maximum wind power in number of times to multiply peak demand power
M11 – store energy capacity in number of days to multiply peak demand power
so I can edit those to see what works.
So that’s how I arrived at my recommendation for energy storage capacity. I hope my method is of some help to you and to others who are modelling such systems.
LikeLike