
Peak demand, wind, solar and back-up power / energy usage and storage capacity calculator
For the specification and design of renewable energy electricity generation systems which successfully smooth intermittent wind and solar generation to serve customer demand, 24 hours a day, 7 days a week and 52 weeks a year.
Adopting the recommendation derived from scientific computer modelling, the tables offer rows of previously successful modelled system configurations – row A, a configuration with no back-up power and rows B to H offering alternative ratios of wind and solar power to back-up power.
 The recommended energy storage capacity is about 90% of one day’s average wind and solar energy generation.
The tables’ columns consist of power and energy variables.
A cell value can be adjusted according to the design criteria and then all the other table values will be recalculated, spreadsheet-style.
The wind and solar power generation Capacity Factor (C.F.) percentages can be adjusted too.
 The energy generation percentages from wind and solar power can be adjusted, either directly using knowledge of local wind and solar capacity factors, or, according to the latitude of the system using a simplistic formula which assumes that wind power generators are preferred near the poles and solar power generators are preferred near the equator.

Latitude
The latitude of a place on the Earth can be specified as a number of degrees from
-90, representing the South Pole,
to 0, representing the Equator,
to 90, representing the North Pole.
A configuration text page for a row which has been adjusted and designed satisfactorily can be opened for text output by clicking on the row’s “TXT” icon in the “Open text page” column.
 Clickable “TXT” Icons in the designer’s tables’ rows. Clickable “TXT” Icons in the designer’s tables’ rows. |
Caution! 💡 Your browser scripts must be allowed and enabled for the designer to work. All browser extension pop-up blockers, ad-blockers, Noscript etc either must be disabled while using the designer or the designer web-page must be trusted and white-listed, if the script-blocker extension even allows white-listing because some may not, in which case disable it.
The recommendations derived from modelling are only specified to 2 significant figures so take with a pinch of salt any apparently third “significant” figures in the numbers output in the configuration text pages.


Open the Wind, solar, storage and back-up system designer (in a new page)

Noting the story in “CLIMATE ACTION. In Partnership with UN Environment”


100% renewable energy fuelled micro-grid successfully operated in 24h test in Illinois
http://www.climateactionprogramme.org/news/100-renewable-energy-fuelled-micro-grid-successfully-operated-in-24h-test-i
I made the following comments …
Well what’s needed is a system design that provides power on demand, reliably 24 hours a day, 7 days a week and 52 weeks a year. To achieve that without diesel back-up generators, I would recommend –
store energy capacity = 1.5 days x peak demand power
annual maximum wind (+ solar) power = 7 x peak demand power
(assuming I only know the system’s peak demand power) –
So for this Ameren micro-grid where I assume “the 50kW onsite microgrid which powers an American research facility” means that the peak demand power is 50kW, I would therefore recommend
(see Grid Watch Demand Focus Table http://scottish.scienceontheweb.net/Wind%20power%20storage%20back-up%20calculator.htm?peak=50&units=kW#grid )
storage energy = 1.5 days x 50kW = 36 hours x 50kW = 1800 kWh
(whereas all the Ameren system has is “500kWh” which is too little by a factor of 3.6)
annual maximum wind (+ solar) power = 7 x 50kW = 350 kW
(whereas all the Ameren system has is “250kW” which is too little by a factor of 1.4)
By “too little” I mean too little for 24/7/52 operation, even though the Ameren system worked perfectly well in the test conditions of that particular 24 hours. Clearly wind and solar power have days of plenty and days of shortage. My recommendations tell you how to design a system that works even on the days of shortage – for those dark days of winter when there’s not much wind blowing either – that’s when your system design gets its ultimate test.
However, my above recommendation assumes that the system’s average power demand is about 60% (30kW) of peak power – (50kW), with an average daily energy usage of about 24 hours x 30kW = 720kWh and a higher maximum daily energy usage.
If the average power used is significantly lower than 30kW and in particular if the maximum daily energy usage is significantly lower than 720kWh then it may well be that not so much storage or wind+solar generation is required.
Supposing although a micro-grid had a peak demand power of 50kW its maximum daily energy usage never was as much as 720kWh but was a lot less.
Let’s assume that the average power was, say, only about 10kW and their average daily usage only 24 hours x 10kW = 240kWh, but their maximum daily energy usage in any one day was a maximum of 482kWh.
Then all that would be needed would be
store energy capacity = 2.4 x maximum daily energy usage
max wind (+ solar) power = 0.4666 per hour x max daily energy usage
(See Off-grid daily usage Focus Table http://scottish.scienceontheweb.net/Wind%20power%20storage%20back-up%20calculator.htm?usage=482&units=kW#off )
energy storage – 2.4 x 482kWh = 1157 kWh and
annual maximum wind (+solar) power = 0.4666 per hour x 482kWh = 225 kW
which is still a factor of 2.3 times more energy storage than the Ameren microgrid has (500kWh) but is exactly the wind+solar power they have.
So it all really depends on what the maximum daily energy usage of the system is. Peak power demand doesn’t completely specify a system’s generation and storage requirements because both peak power and maximum daily energy usage are important design considerations.
Likewise, a 50kW micro-grid which always runs flat out at 50kW (peak demand power was also the average power) and therefore had a maximum daily energy usage of 24 x 50kW = 1200kWh would have a greater energy storage and generation requirement.
(See Off-grid daily usage Focus Table http://scottish.scienceontheweb.net/Wind%20power%20storage%20back-up%20calculator.htm?usage=1200&units=kW#off )
In this case more energy storage 2880 kWh and maximum wind+solar power 560 kW would be required.
LikeLike
V interesting. Have you integrated the possibility of over capacity/storage electrolysed hydrogen being used in fuel cell vehicles or as a supplement to domestic gas supply (not allowed in the uk at present but can be done up to 15%)? The reason I say this is that this would permit sufficient over capacity to mean you could have a 7/24/52 guaranteed electricity supply without waste as surplus could be stored or used elsewhere.
Also what would the impact be of domestic micro-generation? Has anyone done a study as the demand on the grid appears to be going down due to this and other techno?
LikeLike
For configuration rows A to E, one can easily calculate the average daily surplus of wind energy by subtracting the value in the “Daily Usage” column from the value in the “Wind energy per day” column.
In terms of percentages of the Daily Usage = 100%, those surpluses are row A = 169%, row B = 111%, row C = 54%, row D = 27%, row E = 4%.
As I noted on this page https://scottishscientist.wordpress.com/2015/03/08/scotland-electricity-generation-my-plan-for-2020/ in dozens of references to “hydrogen”, those surpluses are available for “wind farm on-site power-to-gas and gas-to-power”. Gas-to-power may be hydrogen fuel-cell or gas turbine generator. See – https://en.wikipedia.org/wiki/Power-to-gas
For demand on the grid going down due to domestic solar micro-generation etc. see https://en.wikipedia.org/wiki/Duck_curve
LikeLike
Perhaps it’s worth factoring in local inter-seasonal heat storage. In the UK about half of energy use and CO2 emissions come from heating demand. Whilst it is extremely difficult and expensive to store electricity, low grade heat can be stored underground, affordably, for months. Perhaps it would make sense for all of the UK to use excess windpower electricity for heat storage in local heat stores and to make use of all the Scottish pumped hydro capacity for electricity for uses other than heating even if that means greatly increasing interconnector capacity between England and Scotland. https://en.wikipedia.org/wiki/Seasonal_thermal_energy_storage
LikeLike
You are welcome to post a comment about heating, thermal energy storage and how the UK’s options for investing in various technologies might effect electricity demand by posting in reply to my comment which begins “Using electricity and renewable energy hydrogen for heating …” in my post Scotland Electricity Generation – my plan for 2020.
In this “Wind, storage and back-up designer” topic, comments are invited about how to use my webpage calculator to design grid configuration capacities for wind power (and other intermittent generators), primary energy storage and back-up dispatchable power in order to meet the grid’s customer power demand.
Those capacities and peak power demand are considered in this topic as scalar quantities – a certain number of watts, or watt-hours. Please note that it is “off topic” in the “Wind, storage and back-up system designer” comments to second-guess grid customers as to what it might, or might not, “make sense” for them to use their electricity, whether for heating or for anything else. In electricity supply, as in retailing generally, the customer is always right.
LikeLike
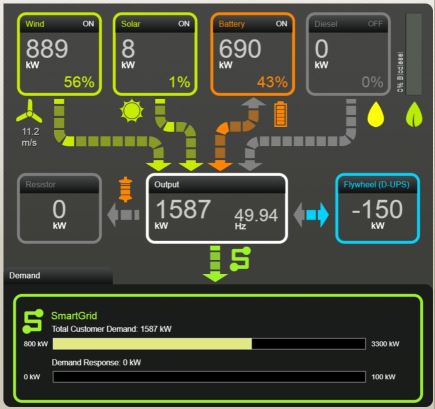
Admittedly, the King Island Advanced Hybrid Power Station was up and running in 2014 before I had got this blog’s socks on in 2015.
Also, I do like the King Island’s real time display on their website.
But as Roger Andrew’s post on Energy Matters in January –“A first look at the King Island, Tasmania, Renewable Energy Integration Project”
– explained “the project is not capable of supplying King Island with much more than 60% renewable electricity”.
Using these 2 data items only from Roger’s post –
* “Its annual electricity consumption is on the order of 13 GWh.”
* “The capacity factor of the wind farm was an impressive 39%.”
and dividing 13GWh by 365 days to calculate a daily usage of 35617 kWh
I can use my “Wind, storage and back-up system designer” web-page with this link to generate a “Off-grid daily usage Focus Table”, whose rows A to H recommend different system configurations that can meet the 100% renewable energy aim, providing that the back-up power is renewable too – bio-diesel, hydrogen from power-to-gas-to-power or biomass etc.
The table’s rows recommend energy storage capacity in the range 12 to 86 MWh – much more than their puny 1.5MWh battery.
Is King Island big enough to build a pumped hydro scheme of a suitable size?
To source most of their energy from the wind, they would need a Row E or above configuration – at least 4 MW of wind power, in which case they can make do with only 1MW of back-up power.
To manage with just the wind turbines and energy storage – without any other back-up power – they’d need a Row A configuration more than 10 MW of wind turbines, 86 MWh storage and then they could use the plentiful surplus power for electrolysis of water to make hydrogen fuel gas (to power their new hydrogen fuel-cell vehicles – or whatever).
LikeLike
News that the The King Island Renewable Energy Integration Project (KIREIP) has added a 1.5MW solar farm.
RenewEconomy: World leading King Island microgrid adds 1.5MW solar farm to mix
So then that’ll be renewables of 2.5MW of wind @ capacity factor of ~ 40% and a new total of 1.97MW of solar @ capacity factor of ~ 10%, with an average daily generation of at least 28MWh.
The problem being that average customer demand daily is more like 33MWh.
Hydro Tasmania: King Island
So even with the addition of more solar power then the diesel backup generator is still going to be running most days.
But what’s really letting the King Island project down is the far too small energy storage capacity of the battery – only 1.5MWh, so energy surpluses cannot be significantly stored, but are wasted either heating the 1.5 MW dynamic resistor or otherwise curtailing generation.
If the King Island project is to become truly “World Leading”, using more renewable energy and less diesel generation, then further upgrades are sorely needed starting with installing a much bigger battery, at least 24MWh but 36MWh is better.
Row F configuration text page.
Peak Demand Power: 2.5 MW
Daily Usage of Energy: 37.5 MWh
Wind Power Capacity: 2.38 MW (2.5MW is plenty)
Wind Capacity Factor: 40%
Solar Power Capacity: 1.88 MW (1.97MW is plenty)
Solar Capacity Factor: 10%
Wind : Solar energy generation ratio = 83.5% : 16.5%
Storage Energy Capacity: 24 MWh (1.5MWh battery is 6% of what is needed)
Back-up power: 1.18 MW (6MW diesel generator is plenty)
The above Row F configuration’s 24MWh storage capacity will increase the renewables efficiency but the diesel generator will still supply much of the power.
Taking it to the next renewables level requires more renewable power – say either +1.1MW of wind power OR +4.5MW of solar power and a 36MWh battery.
Row E configuration text page – MORE WIND POWER
Peak Demand Power: 2.5 MW
Daily Usage of Energy: 37.5 MWh
Wind Power Capacity: 3.56 MW (2.5MW is only 70% of the wind power needed)
Wind Capacity Factor: 40%
Solar Power Capacity: 1.97 MW
Solar Capacity Factor: 10%
Wind : Solar energy generation ratio = 87.8% : 12.2%
Storage Energy Capacity: 36 MWh (1.5MWh battery is 4% of what is needed)
Back-up power: 1 MW (6MW diesel generator is plenty)
Row E configuration text page – MORE SOLAR POWER
Peak Demand Power: 2.5 MW
Daily Usage of Energy: 37.5 MWh
Wind Power Capacity: 2.45 MW
Wind Capacity Factor: 40%
Solar Power Capacity: 6.4 MW (1.97MW is only 30% of what is needed)
Solar Capacity Factor: 10%
Wind : Solar energy generation ratio = 60.5% : 39.5%
Storage Energy Capacity: 36 MWh (1.5MWh battery is 4% of what is needed)
Back-up power: 1 MW (6MW diesel generator is plenty)
Either of those 2 latter Row E configurations reduces the backup power requirement to only 1MW and more days would be 100% renewables than not.
To get to 100% renewables on 100% of the days, you need either a Row A configuration or you need renewable backup power – biodiesel maybe, which is more affordable for Row B & C configurations which use a lot less backup power than a Row E or F configuration.
Use this link to investigate possible configurations for the King Island Renewable Energy Integration Project.
Wind, solar, storage and back-up system designer – King Island Renewables Project
LikeLike
Fair Isle renewable energy electricity scheme

BBC: “The glory of 24-hour power finally reaches Fair Isle”
It looks like the Fair Isle electricity scheme now has more than enough generation capacity for 100% renewable energy operation, though the system is somewhat imbalanced in terms of more power generation than they strictly need but not really enough energy storage to make the best use of all the intermittent power available.
Assuming –
* daily usage of 500kWh
* capacity factor 52%
– the “Off-grid daily usage Focus Table” is generated by this link
Wind Turbines – 180 kW
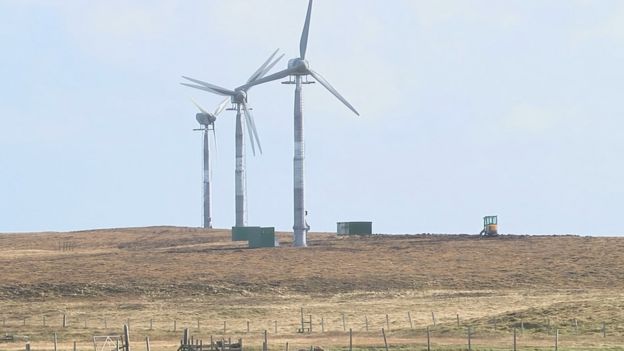
They’ve installed 3 x 60kW = 180 kW and that’s more wind power than my table recommends even for a Row A configuration (108kW).
So they can easily meet their present electricity usage needs even with only 2 out of 3 wind turbines in operation – 2 x 60 kW = 120 kW.
Having a redundant wind turbine will allow for maintenance and repairs on any one turbine while the other two turbines are operating. Smart.
Solar PV Panels – 50 kW
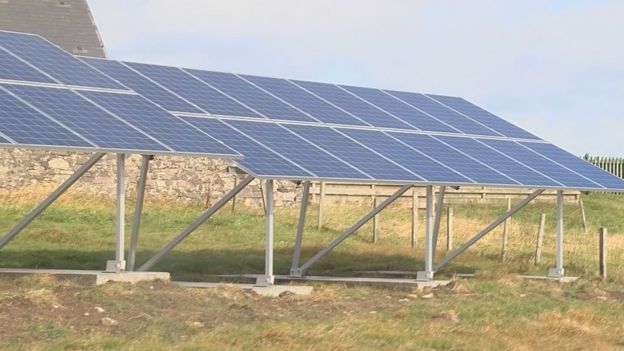
The 50 kW solar array looks surplus to requirements but I suppose that freak flat calm sunny day may happen once in a blue moon and justify the expenditure.
Electric batteries – 500 kWh
They would have been able to generate more energy reliably if they had instead spent more (or more efficiently if pumped hydro is an option there) on more primary energy storage (500kWh is only enough for a Row E configuration) or perhaps considered adding secondary energy storage such as power to gas.
My guess is that once they figure out how much more intermittent power they’ve got they may invest in electric heaters and heat their homes using electricity when the wind is up instead of relying always, as I presume they do now, on some kind of fossil fuel heating.
This is the link that generates the “Wind Generation Capacity Focus Table” for 180kW wind power and capacity factor 52%.
This suggests that with 4 times more energy storage – 2000 kWh – they could supply 4 times more power reliably with the same wind turbines, or even more depending on how much back-up power they have.
Good job! 🙂
LikeLike
Now renamed as the “Wind, solar, storage and back-up system designer” to mark solar’s debut.
http://scottish.scienceontheweb.net/Wind%20power%20storage%20back-up%20calculator.htm
I’ve re-programed my (formerly wind-only) grid systems designer to include solar power and I’ve added a few other useful features too.
If readers have any questions, problems etc arising with the new version then please reply to this comment.
LikeLike
Interesting. I am working on my own de-novo analysis in fits and starts (and completely different technological assumptions), but I’ll have to look at yours and see if there’s anything that might carry over.
LikeLike
I am fuzzy on how the thing works. I hit the “Open text” box to see if that shed any light, but it didn’t do anything for me.
LikeLike
Hey thanks for the feedback! 🙂
The instructions are –
Whereas you say you “hit the “Open text” box”.
There are 4 tables and each table has 8 rows, so that’s 4 x 8 = 32 “TXT” icons at the end of 32 rows.
There is no point whatsoever in clicking on the text “Open text page” in the heading of each table, if that’s what you mistakenly did?
The “TXT” icons are little pictures representing a printed sheet of paper with the corner folded with the letters “TXT”. See them? Choose one of those and click it.
If that doesn’t work then ask yourself if your browser is blocking pop-up pages? The script which is run when you click 1 of the 32 TXT icons tries to open a new window, create a new browser page, whether popped up or as a new browser tab, but if your browser has a pop-up blocker active it may be blocking the script’s attempt to open a new page.
If you think it is a pop-up blocker then see if you can disable the pop-up blocker and try again.
Let me know how you get on.
LikeLike
It’s not a pop-up blocker. When I hover over the icon, the pointer does not change to a finger; the browser does not recognize the icon as having an attached link or function.
I guess I’m going to be mystified for a while longer. Oh, well, back to crunching numbers on FBRs.
LikeLike
Neither does my browser pointer change to a finger but that doesn’t stop me clicking any of the 32 “TXT” icons regardless and that doesn’t stop the browser running the script and creating the configuration text page when I do click regardless.
Did you refuse to click the “TXT” Icon because you were not prompted to do so by any pointer change or did you trying clicking it regardless of no pointer change?
Would you like to try it again and click regardless of no pointer change? Or no way, that would be a bridge too far?
LikeLike
I started off by clicking the icon. Same story now as then: nothing happens when I click it.
I used “Inspect element” to find and copy the Javascript that’s supposed to run. This is what I got:
“rowText(pd1.value,selectunits.value,du1.value,wp1.value,cf.value,-1,sh1.value,bp1.value,sp1.value,scf.value)”
I tried executing that from the command line but I don’t have sufficient Javascript-fu to get the browser to take it as a command rather than a search term.
This has been interesting. Even if I don’t wind up learning anything about wind-energy and storage models, I’m likely to learn something about Javascript.
LikeLike
“Inspect element”? What browser are you using? Internet Explorer?
I developed the script using Chrome (now on version 75) but it does also work in Internet Explorer (version 11).
I’ve not tested any other browsers. Sometimes different browsers or version of browsers handle aspects of Javascript differently which requires some browser compatibility coding which I’ve not had any reason to do as yet but there is maybe some work needing doing in that regard?
After you right-click “Inspect element” can you please click on the “Console” tab that should display if there are any Javascript errors (serious) or warnings (not too serious but of interest).
There should be nothing to report in the Console if all is well but maybe there is something to report and that may explain why the script isn’t working,
What I have also seen cause unexpected Javascript errors is when a free website host adds adverts to customers’ web-pages and then the script for the advert causes fatal interference with the intended web-page script.
As far as I know, the free web-host I am using isn’t adding any adverts, certainly not when they serve the page to me. Can you see any adverts on the designer web-page?
Thanks again for helping me with my software development, Engineer-Poet. It is something I am keen to get to the bottom of so if you can bear with me as and when you’ve got time, that would be much appreciated. 🙂
LikeLike
I’m running Pale Moon in Firefox emulation mode.
When I right-click on the icon and select “Inspect element”, the Javascript console is empty. This is very odd, because I have no indications that any Javascript is being prevented from running (I use Noscript). I also use Adblock Plus, but that seldom seems to cause problems. I switched NoScript to display a message about any blocked scripts, and nothing came up.
Clicking on the icon does not generate any console messages. It’s like the “onclick” in the image tag is being totally ignored. Could there be an incompatibility between the two browser families?
LikeLike
I don’t have Firefox installed on my PC right now. I did use Firefox in the past but maybe that was on my last PC. Can’t remember. Anyway, the script has not been tested for compatibility with Firefox.
I googled “Noscript” and I can read –
“NoScript for Firefox pre-emptively blocks malicious scripts and allows JavaScript, Java and other potentially dangerous content only from sites you trust.”
So it could be that Noscript has assumed that the designer web-page
http://scottish.scienceontheweb.net/Wind%20power%20storage%20back-up%20calculator.htm
is not a site that you trust yet.
If so, then you will have to either
* tell your Noscript browser extension that you trust that site (“Whitelist” the site is what we call it when you explicitly name a site that you trust), or
* or disable Noscript while you use the designer
I don’t use Noscript so I can’t tell you immediately how to whitelist my page, but it will very easy to do once you know how.
Adblock plus is what I was talking about when I asked if you were using a pop-up blocker.
Ads are what some sites pop-up windows to display and it is the window pop-up script that Adblock plus blocks.
OK well then the same applies with Adblock plus. Either whitelist my site with Adblock plus or disable Adblock plus while you use the designer. Again I don’t use Adblock plus so I can’t tell you which is easier to do.
I think we are getting warmer now. I expect that the issue will turn out to be either Noscript or Adblock plus – one or the other – possibly both.
LikeLike
If you failed to read that I did not pre-emptively permit all Javascript from your site, you erred. I already told you so. NoScript reported NOTHING blocked. Try again.
I am on a nearly-clean computer due to a malware attack on my main machine (still not verified fixed). JS on your site is allowed to run, but nothing is running. It’s got to be a browser compatibility issue. If I have time I will install Brave (a Chrome derivative) on this computer and see how your calculator works. Not promising anything.
LikeLike
Try disabling Adblock plus.
Adblock plus is what I was talking about when I asked if you were using a pop-up blocker.
Ads are what some sites pop-up windows to display and it is the window pop-up script that Adblock plus blocks.
LikeLike
PowerMapper reports no browser compatibility issues and no errors, but does report accessibility, search, standards and usability issues for the designer web-page.
That’s further evidence suggesting that Engineer-Poet’s browser extensions were disallowing, disabling or blocking the scripts, after all.
LikeLike
Finally, after nearly 2 years, I tested this using the Firefox browser and I’ve revealed an incompatibility with my “Open text page” script, which I have hopefully now fixed.
Sorry about that. 😳
LikeLike
Having said that I just noticed that the console is sometimes giving one error message –
“Failed to load resource: favicon.ico the server responded with a status of 404 (Not Found)”
– which shouldn’t interfere with the script as far as I know. I am looking for something more serious than that.
LikeLike
OK I have now coded the pointer change function. Thanks for the tip. There was no good reason for not coding the pointer change but I just hadn’t got around to it.
LikeLiked by 1 person
Please note the new web address for the Wind, solar, storage and back-up system designer.
re100.scienceontheweb.net
LikeLike
New table added to the Wind, solar, storage and back-up system designer.
Test My Configuration Focus Table

Features a new “My” row, with 3 input boxes:
* Wind, Solar etc. – an average daily energy value
* Storage – energy capacity
* Back-up power
The table compares the inputs and recalculates in proportion to the table row which generates the most Peak Demand power and Daily Energy Usage, simplistically ignoring any excessive disproportion in the input values.
LikeLike
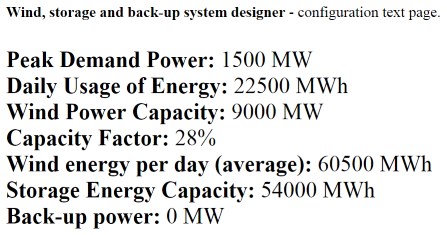
HDF Energy (Hydrogène de France), a developer of large-scale green hydrogen infrastructure and manufacturer of high-power fuel cells, has proposed a solar power farm with co-located energy storage project in South Africa, which they have titled “Renewstable Mpumalanga” and this is the link to the Technology page on their website, which is short of numerical details.
More details were provided by Dexter King’s LinkedIn post.
So a 1500MW solar PV farm, a 3500MWh hydrogen store and a battery of unspecified capacity which I will therefore ignore for now.
Dexter claims this project would be “able to peak close to 500 MW” but here’s my initial analysis.
If nightly regeneration from hydrogen storage was limited to 2571MWh this could be recharged using 6429MWh (at an efficiency of 40%) from the average day’s solar generation of 9,000MWh (from a solar farm power of 1500MW @ 25% capacity factor) leaving another 2571MWh for daytime generation.
So an average solar-powered generation of about 214MW, 5142MWh/day peaking at around 340MW, is possible most days, but it is inevitable that on consecutive cloudy, dark days there would not be enough solar energy to sustain this supply to the grid, the 3500MWh hydrogen store having discharged all too soon.
So if HDF is promising to supply the grid with a daily peak of close to 500MW then they will also need a 500MW fossil fuel back-up generator to do so reliably!
LikeLike